Back
24 Feb 2020
USD/JPY New York Price Forecast: Dollar retreating slightly after massive surge last week
- USD/JPY is starting the week trading in the red after a large breakout last week.
- The correction might lead USD/JPY to trade sideways below the 112.00 figure.
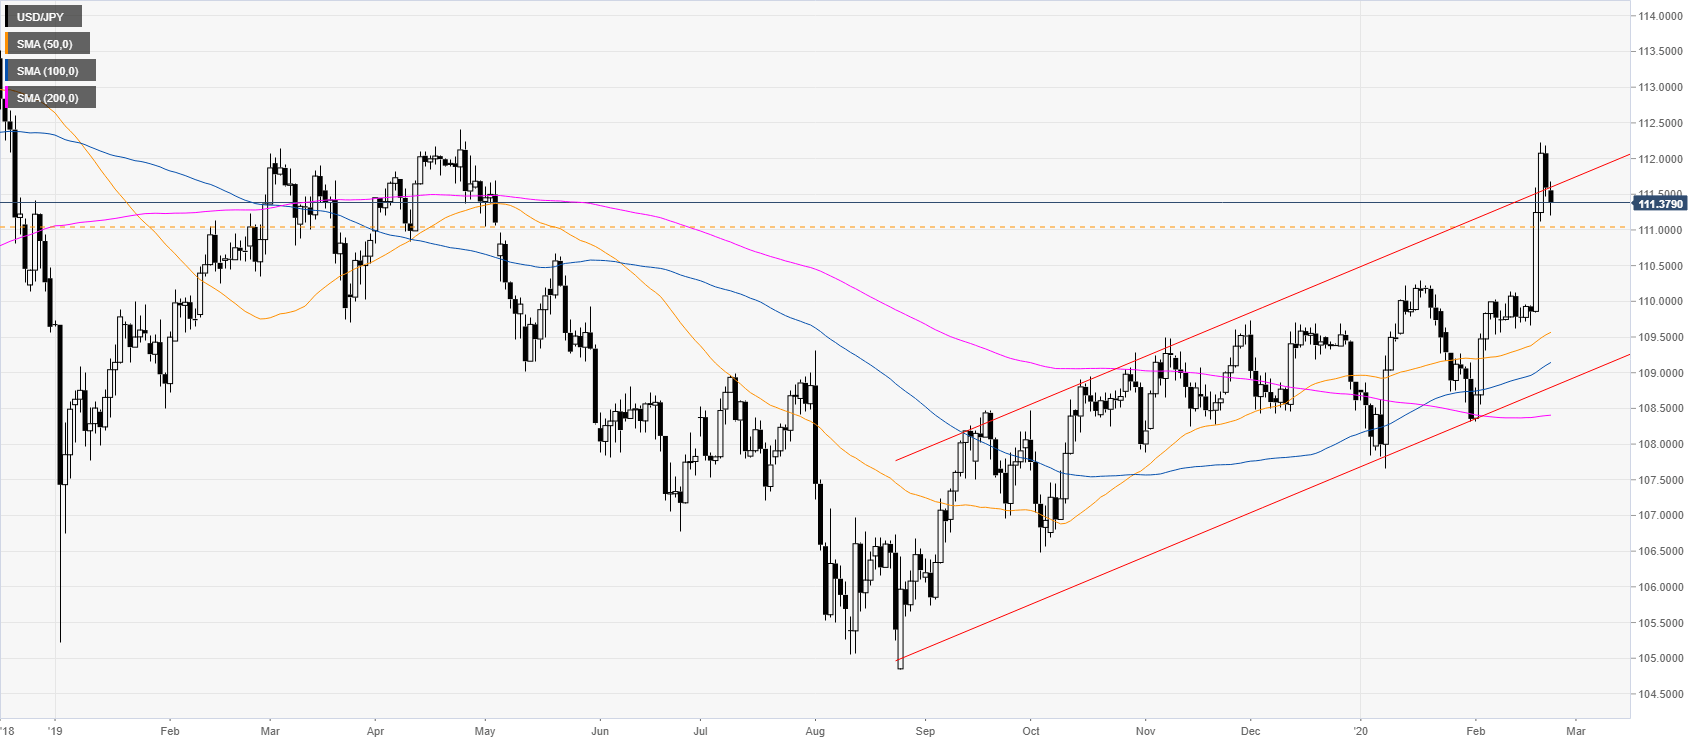
USD/JPY daily chart
USD/JPY broke above a bull channel while spiking above the main daily simple moving averages (SMAs). The market is pulling back down after two consecutive days of above-average intraday rallies.
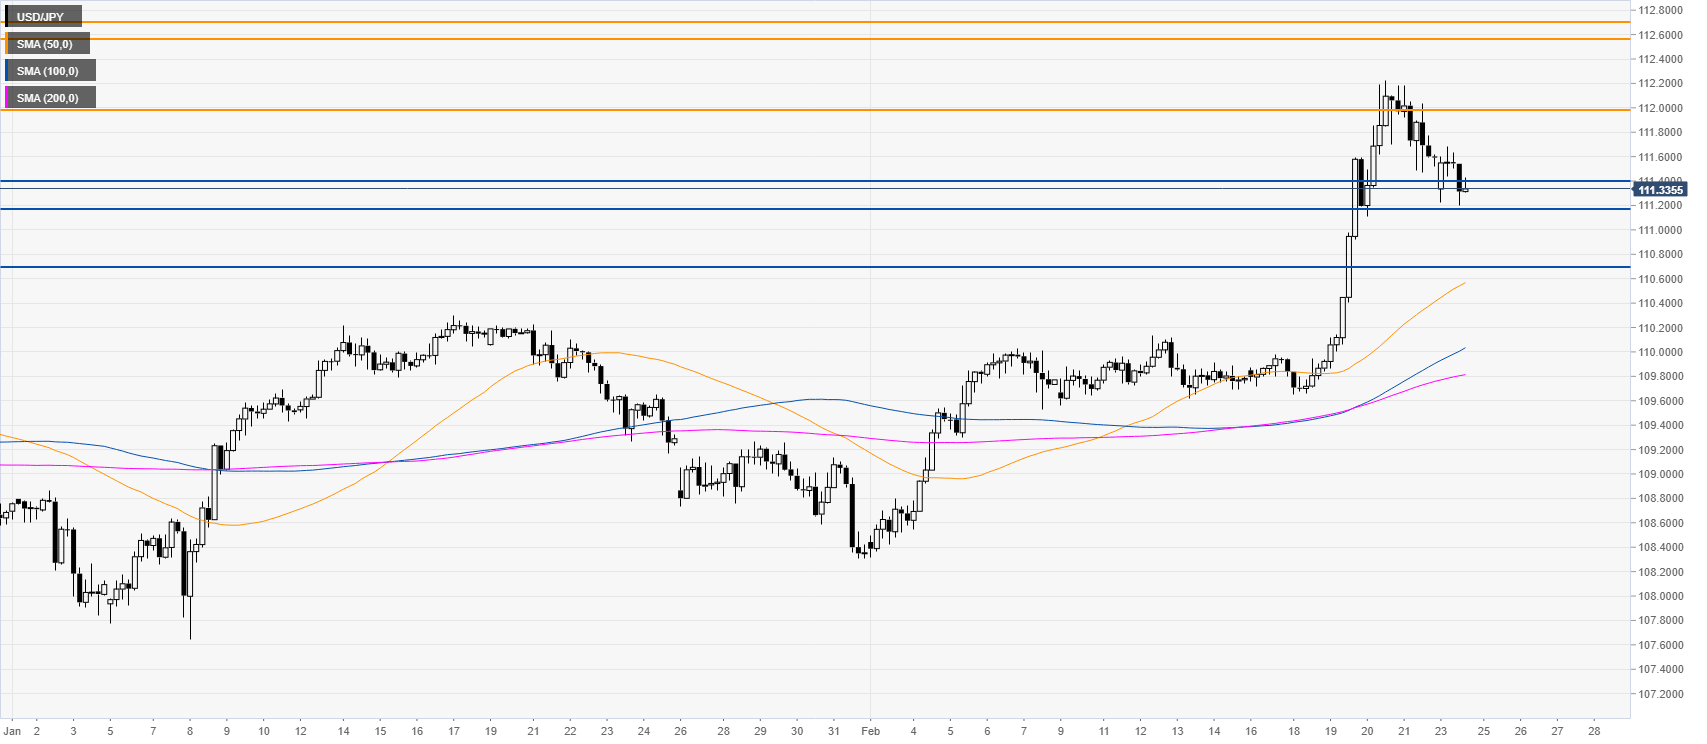
USD/JPY four-hour chart
Dollar/Yen is correcting down after a very volatile last week. The market is challenging the 112.57/91 support zone and a break below it could lead to a deeper retracement to the 110.71 level. Resistance can be found near the 112.00 figure while a daily close above 117.17/110.71 resistance zone would likely see another extension of the bull move towards higher levels, according to the Technical Confluences Indicator.
Resistance: 112.00, 112.57, 112.91
Support: 111.41, 111.17, 110.71
Additional key levels