Back
11 Feb 2020
WTI Price Analysis: Pierces three-day-old resistance trendline
- WTI snaps two-day losing streak.
- A confluence of 200-bar SMA, the monthly trend line acts as the key resistance.
- Fresh downside below the latest lows could recall late-2018 levels.
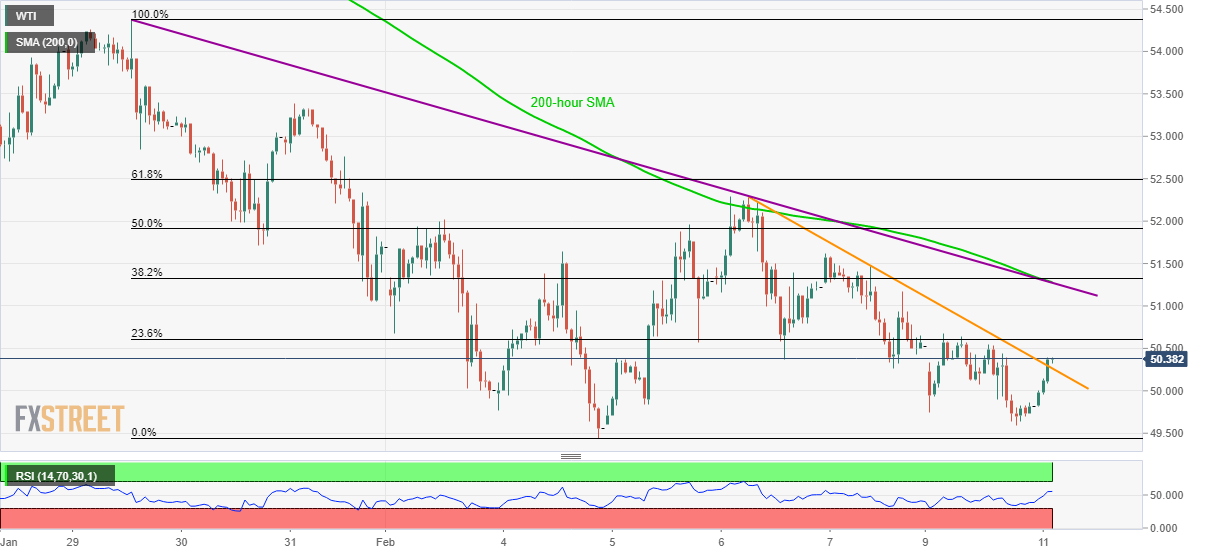
WTI trades 1.2% positive to $50.35 during the early hours of Tuesday. In doing so, the black gold breaks a short-term falling trend line stretched from Friday.
As a result, the quote is likely rising towards 23.6% Fibonacci retracement of its fall from January 29 to February 04, at $50.60.
However, a confluence of 200-bar SMA, a descending trend line since January 29 and 38.2% Fibonacci retracement could challenge the bulls around $51.30, if not then the current month’s top near $52.30 will be their favorite.
Meanwhile, the energy benchmark’s drop below the latest lows surrounding $49.50/40 could recall December 26, 2018 top near $47.00.
WTI hourly chart
Trend: Pullback expected