USD/JPY Price Analysis: Fresh upside likely if breaking three-day-old falling trend-channel
- USD/JPY fails to extend the losses made Wednesday but buyers look for a confirmation of the bullish technical pattern.
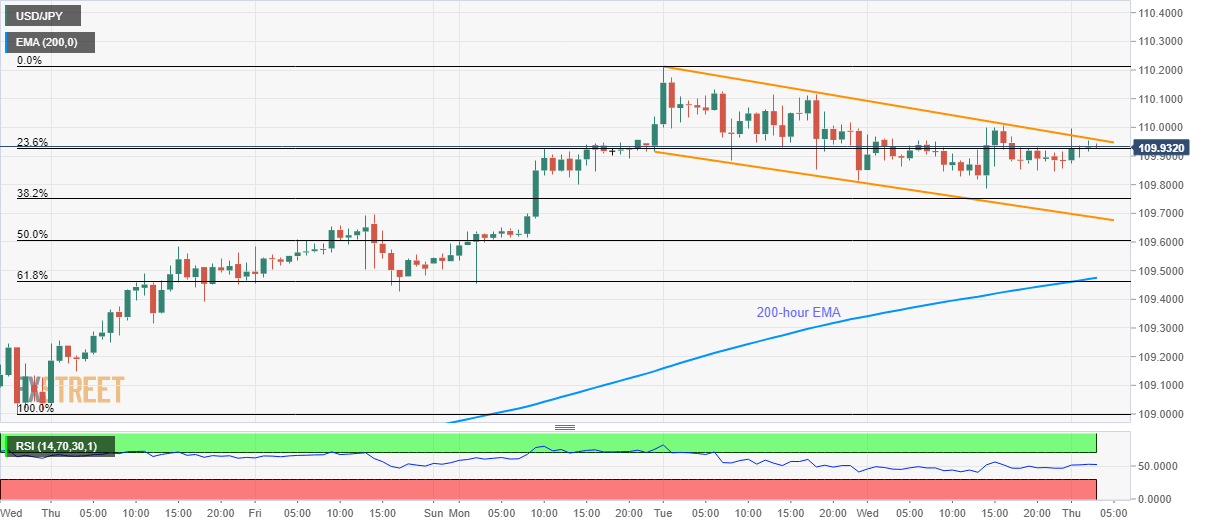
- A confluence of 200-hour EMA, 61.8% Fibonacci retracement offers strong downside support.
USD/JPY recovers to 109.94 during the early trading hours of Thursday. The pair recently bounces off 109.80/78 support-zone but is yet to break short-term descending trend channel to please the Bulls.
In doing so, 110.00 will be the key to justify the bullish technical formation that will push buyers towards the recent high surrounding 110.25 and May 2019 to near 110.70.
During the quote’s advances past-110.70, 111.00 round-figure could return to the chart ahead of highlighting the year 2019 peak close to 112.00.
Alternatively, 109.80 and the channel’s support near 109.65 could keep the pair’s pullback limited.
If at all sellers conquer 109.65, 200-hour EMA and 61.8% Fibonacci retracement of the pair’s rise between January 08 and 14, around 109.50/45 will challenge the bears.
USD/JPY hourly chart
Trend: Pullback expected