Back
9 Jan 2020
Gold Price Analysis: XAU/USD easing from multi-year tops, trades sub-$1560/oz
- The metal is trading below the 1560/1600 resistance zone.
- Support is seen at the 1520 and 1480 levels.
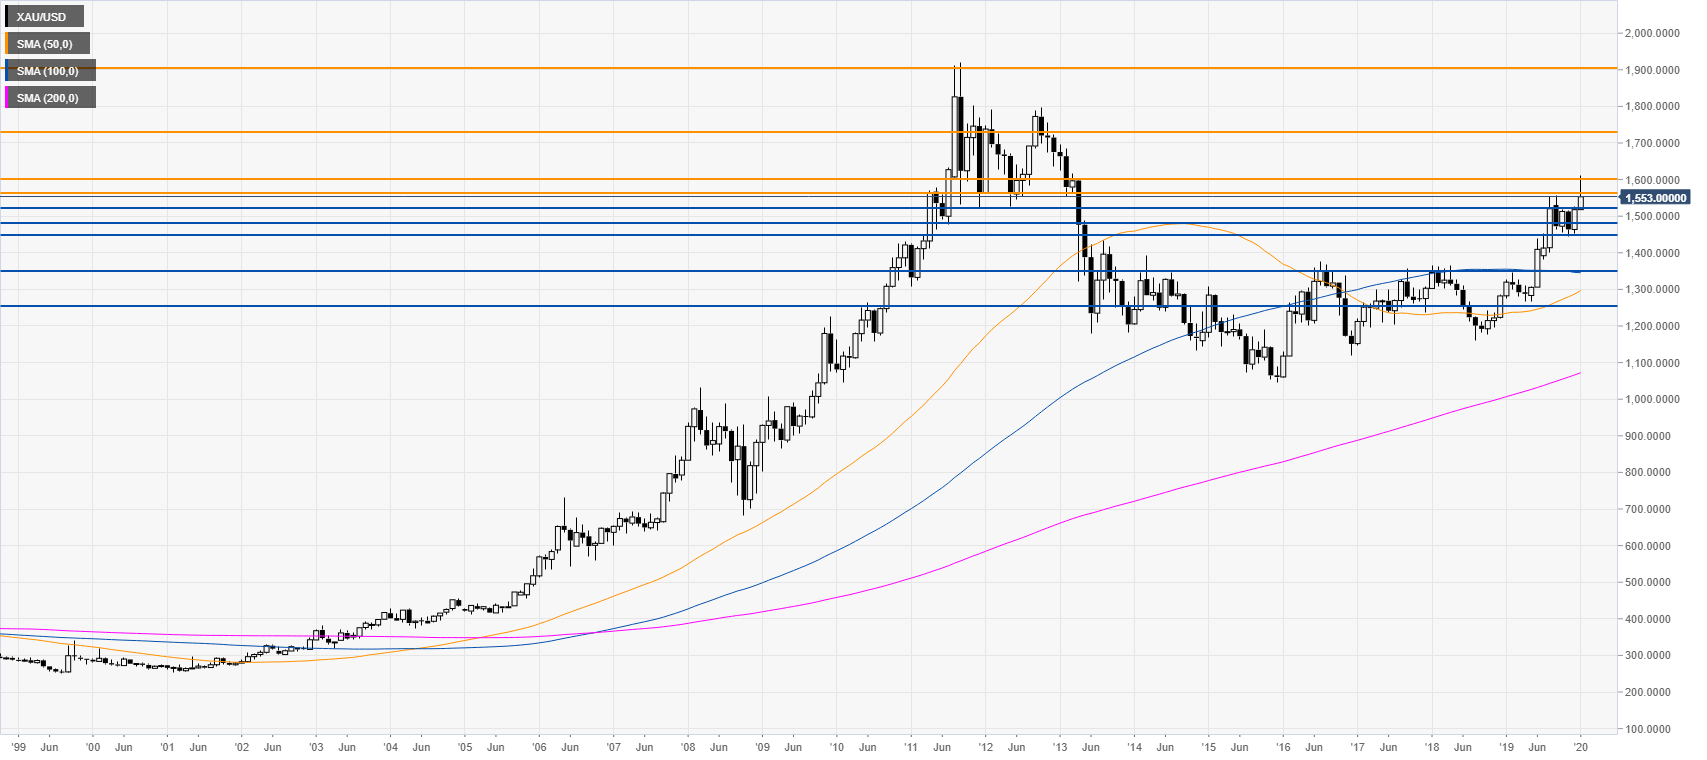
Gold monthly chart
Gold is trading in a bull trend above its main monthly simple moving averages (SMAs). The metal is trying to breakout above the 1560/1600 price zone. If the buyers overcome this critical resistance zone on a daily basis, the metal might move up towards the 1730 and 1900 resistance levels.
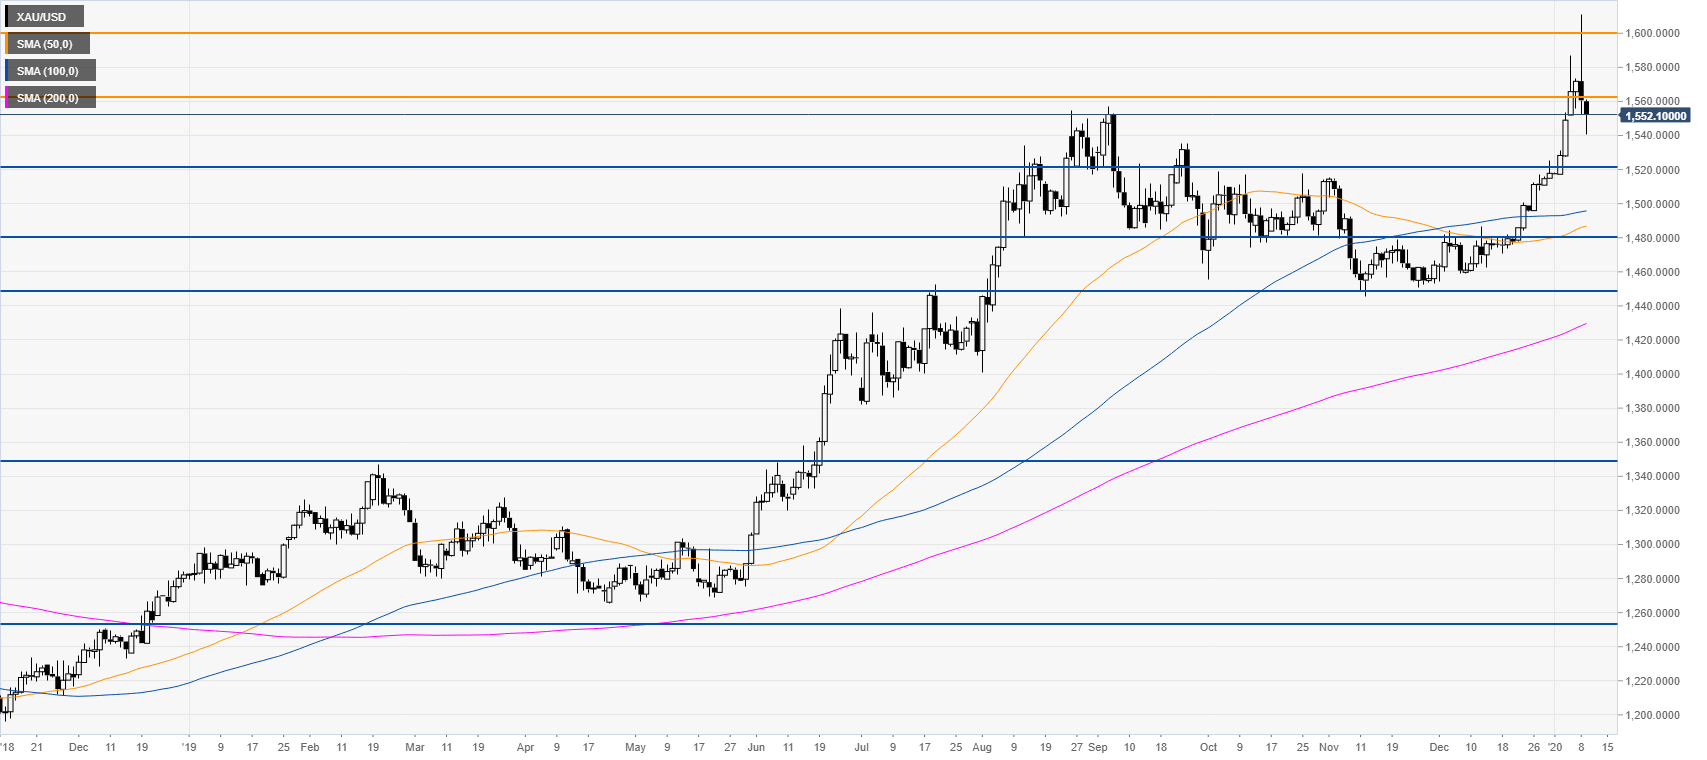
Gold daily chart
The metal is rejecting the 1600 figure and is now trading below the 1560 resistance. A daily close below the 1560 level could entail the beginning of a correction down. Support is seen at the 1520 and 1480 levels.
Additional key levels