Back


11 Oct 2019
USD/JPY technical analysis: Greenback at its highest since July against Yen, above 108.00 handle
- The safe-haven Yen is being dumped as the trade talks are sparking positive market sentiment.
- USD/JPY is challenging the 108.56 resistance in the New York session.
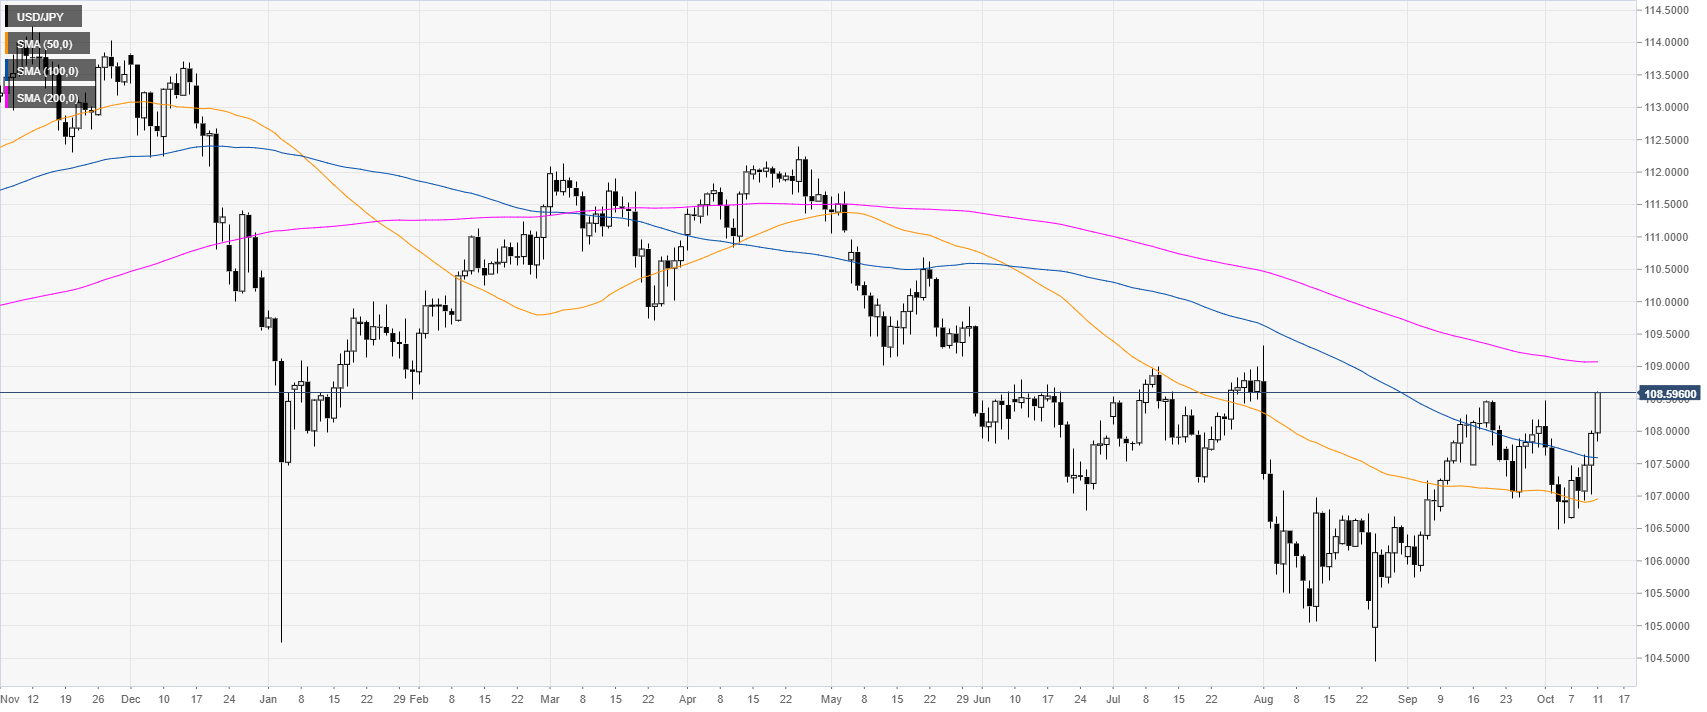
USD/JPY daily chart
The USD/JPY exchange rate is trading in a bear trend below its 200-day simple moving average (DSMA). However, the market is rebounding sharply from the October lows and is now challenging levels not seen since late July.

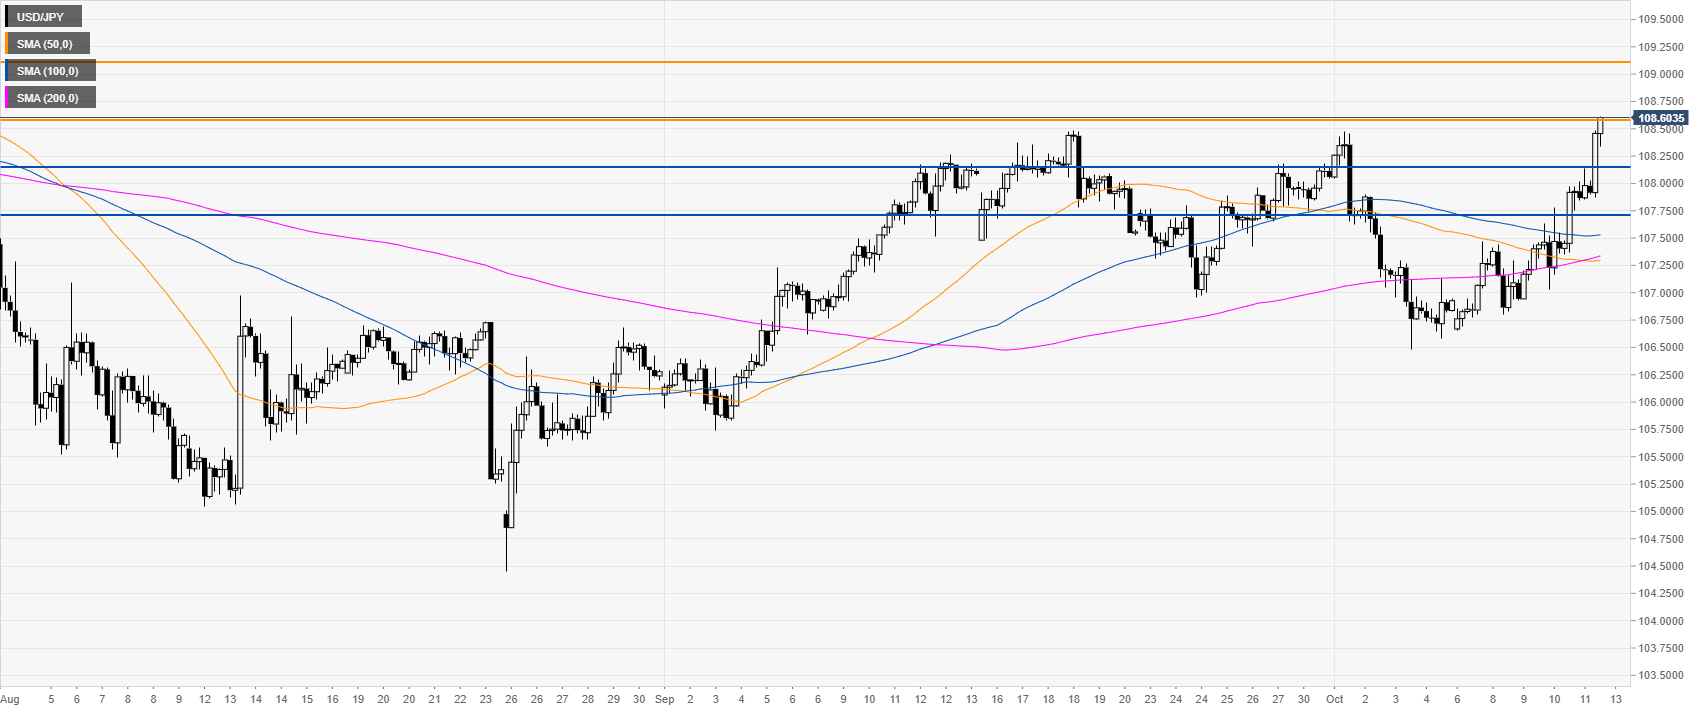
USD/JPY four-hour chart
USD/JPY is trading above its main SMAs on the four-hour chart, suggesting bullish momentum in the medium term. The market is challenging the 108.56 resistance. A daily close above this level can open the doors to the 109.12 price level, according to the Technical Confluences Indicator.

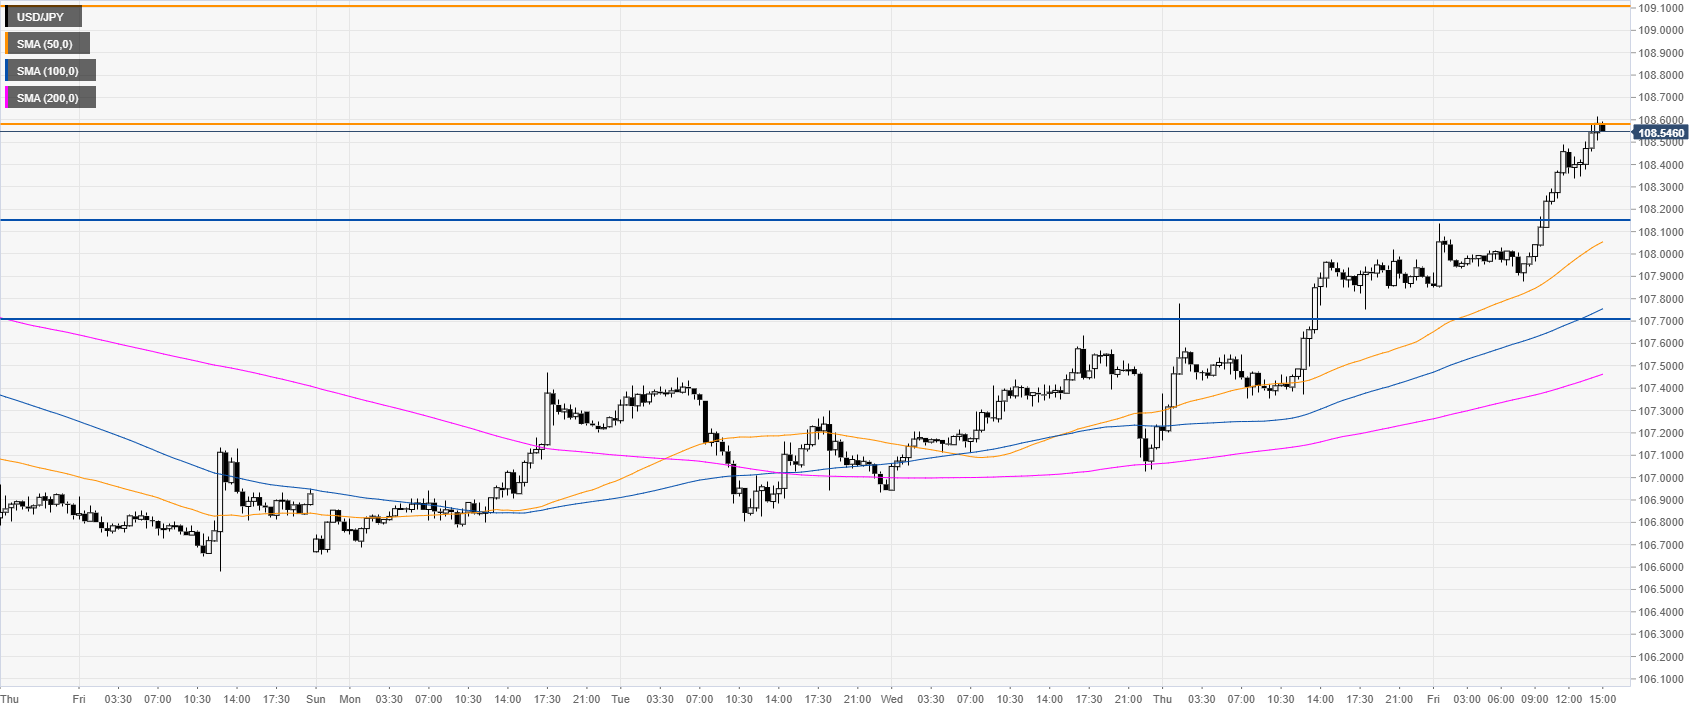
USD/JPY 30-minute chart
The USD/JPY currency pair is trading above the main SMAs, suggesting bullish momentum in the near term. Immediate supports are seen at the 108.16 and 107.70 levels, according to the Technical Confluences Indicator.

Additional key levels
